Fibre Optic TCO: Total Cost of Ownership for Modular Splice Systems
Fibre Optic TCO: Total Cost of Ownership for Modular Splice Systems – Complete Cost Analysis for Network Managers
The fibre optic TCO (Total Cost of Ownership) and splice box cost calculation encompass far more than acquisition prices alone – on average, hardware and initial installation account for only 40-50% of total costs over the operational lifespan. The remaining 50-60% is attributable to maintenance, expansions, downtime, and labour costs for network changes. Modular splice systems reduce these hidden costs through tool-free assembly and flexible scalability by up to 35%.
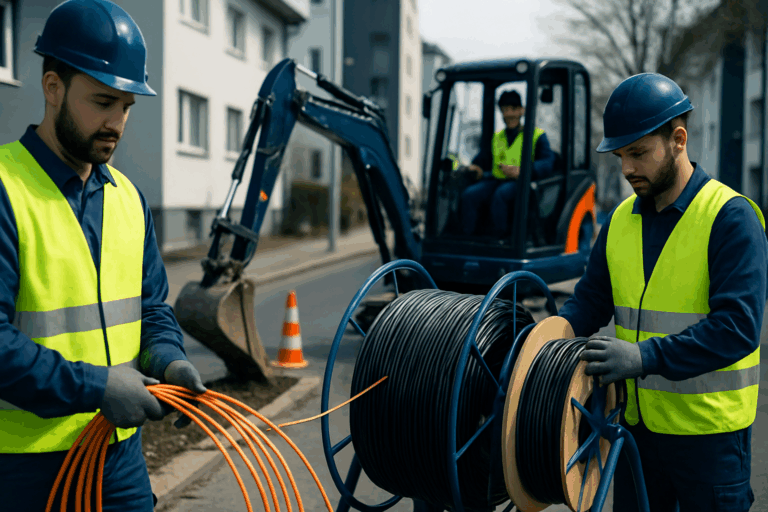
Finance managers and procurement teams face the challenge of evaluating not only initial investments but the complete lifecycle costs of their infrastructure during fibre rollout. Particularly with the current FTTH expansion wave affecting 8.6 million buildings in Germany, the right system choice becomes a decisive economic factor.
Cost structure of modular fibre optic systems: The four main TCO factors
The total cost calculation for fibre optic splice infrastructure breaks down into four central areas, which must be calculated over a typical evaluation period of 10 to 15 years:
- Acquisition costs (25-35% of TCO): Splice boxes, modules, cassettes, adapters and initial equipment
- Installation costs (15-20% of TCO): Assembly, splicing work, documentation and commissioning
- Operating costs (30-40% of TCO): Maintenance, cleaning, measurements and ongoing inspections
- Change costs (15-25% of TCO): Re-patching, expansions, technology migration and adjustments
With conventional fixed systems, these proportions shift significantly: changes can account for up to 40% of total costs, since every adjustment requires complete system replacement. Modular systems, by contrast, allow targeted replacement of individual components without operational interruption.
Comparison: Modular versus fixed-installed splice systems
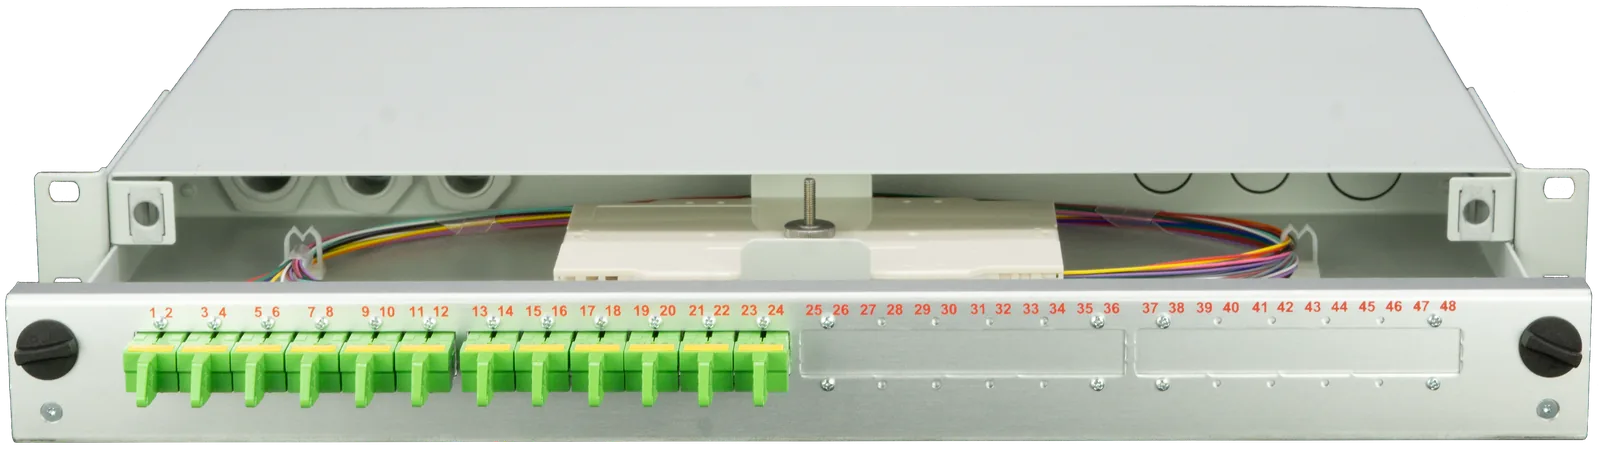
The fibre optic TCO differs fundamentally between modular and fixed-installed systems. A detailed comparison calculation for a typical installation with 48 fibres on 1RU demonstrates significant savings potential:
| Cost item | Fixed system (10 years) | Modular system (10 years) | Savings |
|---|---|---|---|
| Hardware acquisition | €3,500 | €4,200 | -€700 |
| Installation (8h vs. 3h) | €640 | €240 | +€400 |
| Maintenance (annually) | €2,000 | €1,200 | +€800 |
| 3 technology migrations | €4,500 | €1,800 | +€2,700 |
| Downtime (hours) | €1,600 | €400 | +€1,200 |
| Total TCO costs | €12,240 | €7,840 | +€4,400 (36%) |
The higher initial costs of modular systems amortise within an average of 2.3 years through lower operating costs. The advantage is particularly evident during expansions: while fixed systems must be replaced entirely, modular solutions require only the exchange of individual slots.
Port density as a TCO lever: Cost efficiency through maximum packing density
Packing density significantly influences splice box cost calculation through saved rack space and reduced infrastructure costs. Modern high-density systems achieve up to 96 fibres on 1RU – a doubling compared to standard systems with 48 ports.
- Space costs: At an average of €35/RU/month in German data centres, every saved rack unit saves €4,200 annually
- Cooling costs: Fewer enclosures mean lower energy demand for air conditioning (approximately 15% savings)
- Cabling effort: Centralised high-density points reduce cable lengths by an average of 30%
- Administrative overhead: Fewer physical units simplify documentation and maintenance
Fiber Products Quality Promise: As an official Diamond Partner and manufacturer, we produce modular splice systems in Europe. Benefit from Swiss precision and 5 years of warranty on our systems – a unique added value for your TCO calculation.
Labour costs and installation times: The underestimated TCO factor
Labour time represents a substantial portion of Total Cost of Ownership in the installation and maintenance of fibre optic infrastructure. At an average rate of €80 per hour for qualified technicians, even small time savings add up to significant amounts.
Modular systems with tool-free assembly drastically reduce installation times. A typical 48-port installation requires approximately 8 hours of work with fixed systems, whereas modular solutions are operational in 3 hours. With 20 installations annually, this translates to savings of €8,000 in labour costs alone.
- pre-configured splice boxes: 75% time savings during initial installation
- DIN colour coding: Error rate drops by 90%, fewer rework requirements
- Front-side access: Maintenance without dismounting adjacent systems
- Labelling systems: Integrated identification saves 30 minutes per maintenance visit
Maintenance and operating costs: Long-term TCO optimisation
Ongoing operating costs in fibre optic TCO are frequently underestimated but represent the largest cost block over the service life. Regular maintenance according to IEC 61300-3-35 is not only mandated by standards but also ensures transmission quality.
A structured maintenance concept for modular splice systems includes quarterly visual inspections, semi-annual cleaning, and annual attenuation measurements. Costs for modular systems average approximately €120 per RU annually, whilst fixed systems require about €200 due to more difficult access.
| Maintenance activity | Frequency | Time fixed system | Time modular system | Cost savings/year |
|---|---|---|---|---|
| Visual inspection | Quarterly | 30 min. | 10 min. | €106 |
| Connector cleaning | Semi-annual | 2 hrs. | 45 min. | €150 |
| Attenuation measurement | Annual | 3 hrs. | 1.5 hrs. | €120 |
| Documentation | With changes | 1 hr. | 15 min. | €180 |
Technology migration and future-proofing in TCO analysis
Fibre optic technology evolves continuously – from LC vs SC vs E2000 connector comparison, from multimode to singlemode OS2. With fixed systems, every technology migration means complete replacement, whilst modular systems enable gradual migration.
In splice box cost calculation, technology migrations account for an average of three adjustments over 10 years. For a 96-port installation, this means €4,500 in replacement costs per migration plus downtime with fixed systems. Modular systems such as VarioConnect 3RU allow targeted module replacement for approximately €600 per migration.
- Connector variety: LC, SC, E2000, ST and MPO combinable in a single system
- Mixed operation: Parallel operation of old and new technology during migration
- Scalability: Expansion from 48 to 96 ports without system change
- Standards compliance: Adaptation to new standards through module replacement
Downtime and availability: The hidden cost driver
Unplanned downtime often causes the highest indirect costs in Total Cost of Ownership. For critical infrastructure, outages can cost €500-2000 per hour. Mean Time To Repair (MTTR) is significantly reduced by modular design.
Fixed-installed systems require complete dismounting and recabling in case of defects – a process taking 4-6 hours. Modular systems allow defective component replacement in under 30 minutes. With an average of two failures annually, this alone saves €8,000 through reduced downtime.
Availability increases through redundant design and maintained spare modules to 99.99% (52 minutes downtime/year) versus 99.9% with fixed systems (8.7 hours/year). This difference is particularly critical for data centres and municipal utilities with service obligations.
Subsidies and financing models: TCO optimisation through government programmes
The fibre optic TCO can be substantially reduced through strategic use of support programmes. The federal government provides several billion euros annually for fibre rollout through various schemes. Modular systems meet subsidy criteria particularly well through their future-proofing.
- Federal Broadband Support: Up to 50% subsidy for underserved areas
- Gigabit Support 2.0: Focus on business areas and public institutions
- KfW programmes: Low-interest loans for municipal utilities
- Regional support: Additional programmes in Bavaria, North Rhine-Westphalia and Baden-Württemberg
The subsidy rate increases when using sustainable, European-manufactured components. Systems with 5-year warranty on fibre optic components are preferred in tenders, as they guarantee lower follow-up costs. Documentation requirements for subsidies are simplified by modular systems with clear identification.
Environmental costs and sustainability in total cost calculation
Sustainability aspects are gaining increasing importance in splice box cost calculation. Carbon pricing and stricter disposal regulations impact TCO. Modular systems reduce material consumption by up to 60% over the service life.
For disposal, fixed systems incur average costs of €150 per RU, whilst modular systems only require replacement of defective modules (approximately €20 per module). The reuse rate for modular components exceeds 80%, whilst fixed systems achieve less than 30%.
| Sustainability factor | Fixed system | Modular system | TCO benefit |
|---|---|---|---|
| Material consumption (10 years) | 45 kg | 18 kg | €270 disposal savings |
| Carbon footprint | 380 kg CO2 | 145 kg CO2 | €47 at €0.20/kg CO2 |
| Recycling rate | 30% | 80% | Scrap value +€120 |
| Transport effort | 12 deliveries | 4 deliveries | €320 logistics savings |
Case study: TCO calculation for a mid-sized municipal utility
A concrete calculation example clarifies Total Cost of Ownership for a municipal utility with 5,000 FTTH connections. The infrastructure comprises 20 distribution points with 288 fibres each (3RU). The evaluation period is 15 years with planned expansions.
The utility faced a choice between low-cost fixed systems at €180,000 initial investment or modular systems at €235,000. However, the 15-year TCO analysis revealed a clear picture favouring the modular solution:
- Initial costs: +€55,000 additional cost for modular systems
- Installation savings: -€32,000 through 40% faster assembly
- Maintenance savings: -€84,000 through simplified access (15 years)
- Expansion costs: -€126,000 through modular adjustment instead of complete replacement
- Downtime reduction: -€67,000 through 75% shorter MTTR
- Total TCO savings: -€254,000 over 15 years
The additional investment amortised within 2.6 years. Additionally, the utility benefited from 50% federal subsidy on initial investment, reducing payback to under 18 months.
Calculation and assessment: TCO calculator for your infrastructure
For accurate fibre optic TCO calculation of your specific installation, individual parameters must be considered. The most important calculation factors for your assessment:
Your technicians’ hourly rate, local space costs, planned expansions and infrastructure criticality significantly influence the economic calculation. With hourly rates above €70 and more than 96 fibres, modular systems typically amortise within 2 years.
- Fibre count: From 48 fibres, modular systems show cost advantages
- Change frequency: With more than 2 changes annually, clear TCO advantage
- Availability requirement: Above 99.9%, modular systems are more economical
- Operating period: From 5 years use, operating cost advantages dominate
- Technology mix: With various connector types, modules save up to 45%
FAQ: Frequently asked questions about fibre optic TCO calculation
How do I calculate Total Cost of Ownership for my fibre optic infrastructure?
TCO calculation includes acquisition costs, installation (hours × hourly rate), annual maintenance (approximately 3% of investment), planned expansions and downtime risk. Modular systems reduce items 2-5 by 30-60%. A professional TCO analysis should cover at least 10 years of operation.
At what size do modular splice systems become economically viable?
Modular systems are economically justified from 48 fibres or 2 changes annually. For installations under 24 fibres without planned changes, fixed systems may suffice. The threshold decreases with high labour costs above €80/hour or critical applications.
Request a quote
Do you have questions about our fibre optic solutions? Our expert team is happy to advise you – free and without obligation.